Your status page should never be the last to know. With endpoint monitoring, Statusentry calls your service on a schedule and tells your team the moment it stops responding — and again when it's back.
Until now, Statusentry did one job: helping you communicate incidents to customers. But you can only communicate an outage once you know about it, and too many teams still learn about downtime from a customer's support ticket. Endpoint monitoring closes that gap, right inside the tool you already use for your status page.
What is endpoint monitoring?
Endpoint monitoring (also called uptime monitoring or HTTP monitoring) means sending a request to a URL at a regular interval and checking the response. If the endpoint answers with a healthy status code within a time limit, all is well. If it returns an error, times out or can't be reached, something is wrong and someone should look at it.
In Statusentry, every service on your status page can have its own monitor. You point it at the URL that best represents that service — a health-check route, your login page or a key API call — and Statusentry takes care of the rest.
How it works
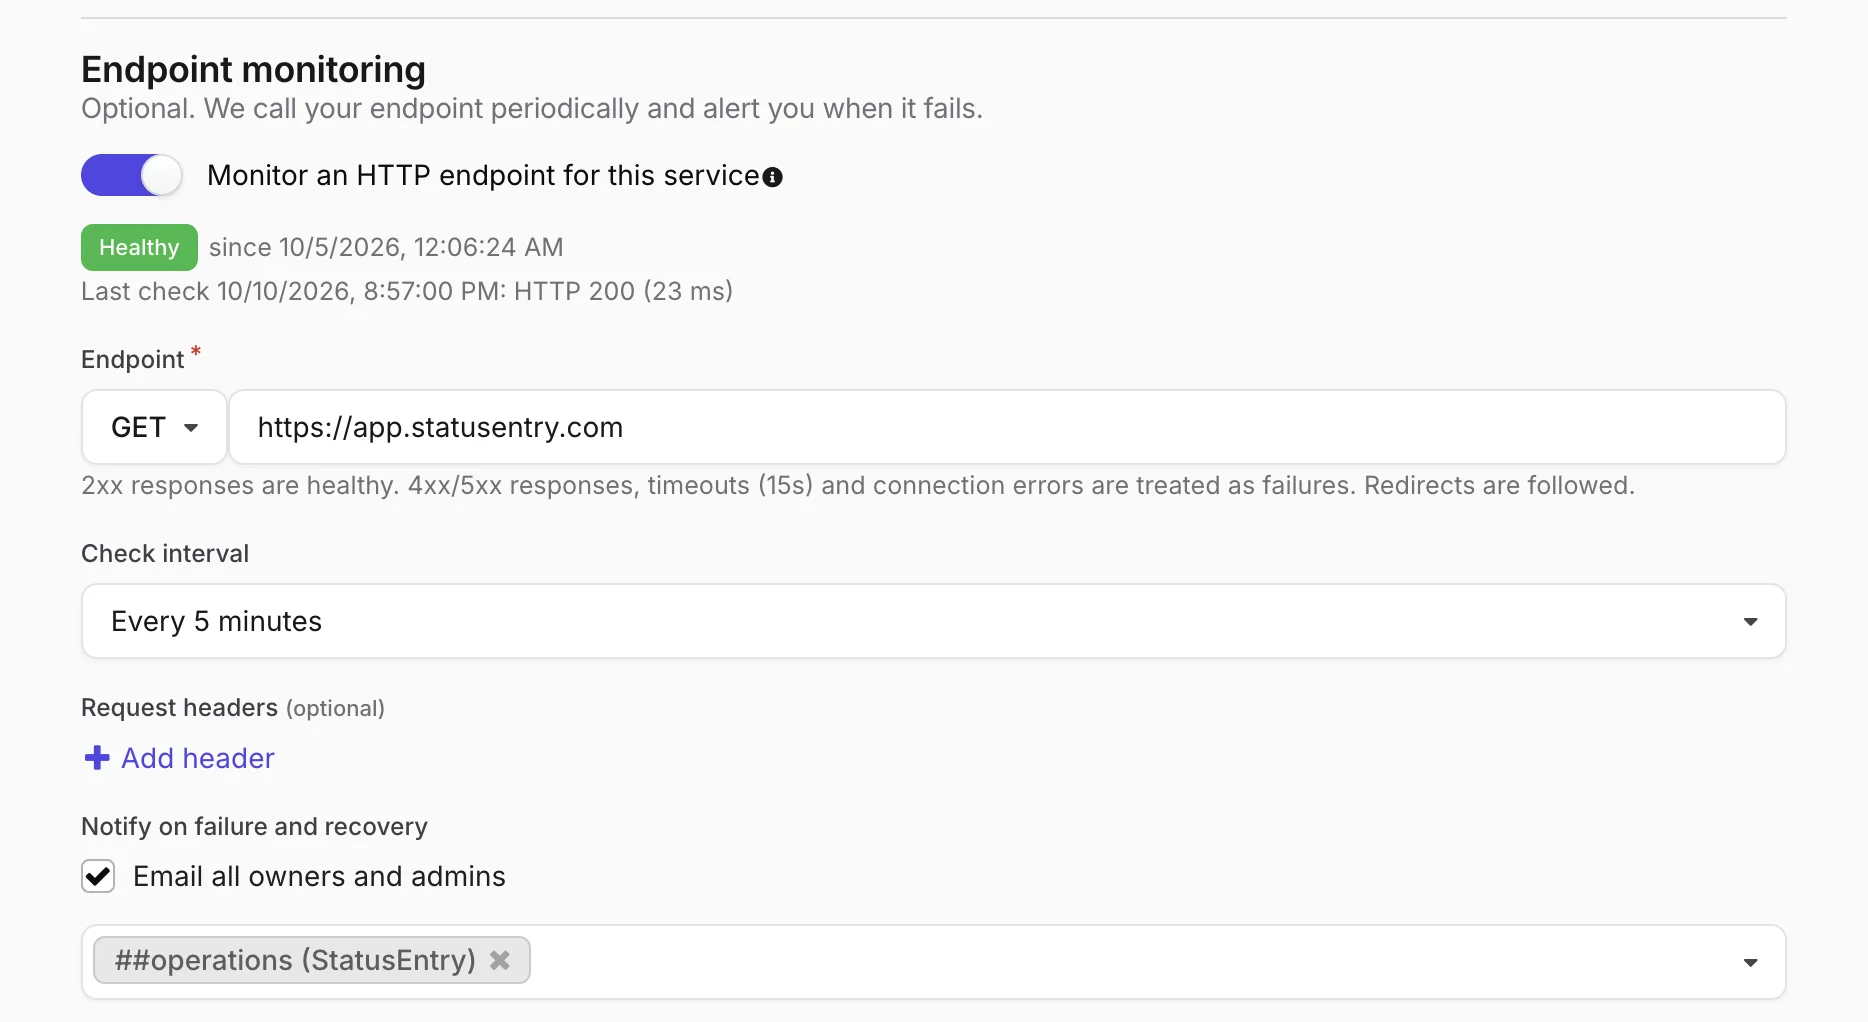
Open any service in the admin panel, switch on Monitor an HTTP endpoint for this service and fill in a few fields:
- Endpoint: the URL to call and the HTTP method. GET is the default; HEAD, POST, PUT, PATCH, DELETE and OPTIONS are supported too.
- Check interval: every 5, 10, 15 or 30 minutes, or every 1, 2, 6, 12 or 24 hours.
- Request headers (optional): add an API key, a bearer token or a custom header if the endpoint needs one. You can also send a request body.
- Notify on failure and recovery: email all owners and admins, post to one or more Slack channels, or both.
That's it. The panel then shows the monitor's current state — for example Healthy since 10/5/2026 — together with the last check: the time, the HTTP status code and the response time in milliseconds.
What counts as healthy?
The rules are simple and predictable:
- Healthy: any 2xx response.
- Failing: 4xx or 5xx responses, connection errors, and requests that take longer than 15 seconds.
- Redirects are followed, so a URL that redirects to a healthy page is healthy.
Alerts that don't spam you
Statusentry alerts on changes, not on every failed check. When a healthy endpoint starts failing, owners and admins get an email and your Slack channel gets a message with the endpoint, the result (for example HTTP 503 or a timeout) and when it was detected. You won't get another alert every five minutes while the problem continues.
When the endpoint answers with a 2xx again, you get a recovery message that says how long it was down — for example “endpoint check recovered after 9 minutes”. Every alert links straight to the service, so you can open an incident and update your status page in the same place.
Why built-in monitoring matters
- Know before your customers do. Every minute between an outage starting and your first update is a minute of “is it down?” tickets.
- One tool instead of two. Many status page tools, including Atlassian Statuspage, rely on a separate monitoring product. Statusentry includes it in your plan.
- Monitoring lives next to communication. The alert, the service and the incident form are one click apart.
- Safe by design. Checks only call public addresses, every redirect target is validated, and each check runs exactly once even though our platform runs on several servers.
Plans and limits
Endpoint monitoring is included in every paid plan. Each check counts toward a monthly quota:
- Start Up ($9.99/month): 2,000 checks per month
- Business ($19.99/month): 20,000 checks per month
- Enterprise ($39.99/month): 100,000 checks per month
To estimate what you need: one endpoint checked every 5 minutes uses about 8,640 checks in a 30-day month; checked every 15 minutes, about 2,880; checked every hour, about 720. If your account reaches its monthly limit, monitoring pauses and owners are notified, then it resumes automatically when the quota resets. See all plans on the pricing page.
Get started in two minutes
- Sign in to app.statusentry.com (or create a free account — new accounts get a 30-day Enterprise trial).
- Open Services and pick the service you want to monitor.
- Switch on Monitor an HTTP endpoint for this service, enter the URL and choose an interval.
- Choose who gets notified — email, Slack or both — and save.
The first check runs right away, and you'll see the result in the panel within seconds. Questions or feedback? Write to support@statusentry.com.